
How to Track Rep Call Activity in HighLevel
HighLevel call reporting 7 min read
HighLevel call reporting in Phone Clover - the metrics that matter, Today/7/30 day views, call log filters, by-rep stats, and CSV export, explained plainly.
- Best for
- A manager who wants a live view of team call activity, who to coach, and which calls still need a callback, without exporting from three tools.
- Not for
- A team that needs trend charts over time, a multi-sub-account agency rollup, or CSV exports larger than 1,000 rows.
- The difference
- Today, 7-day, and 30-day stat tiles plus a by-rep table, versus building a trend view yourself from weekly CSV exports.
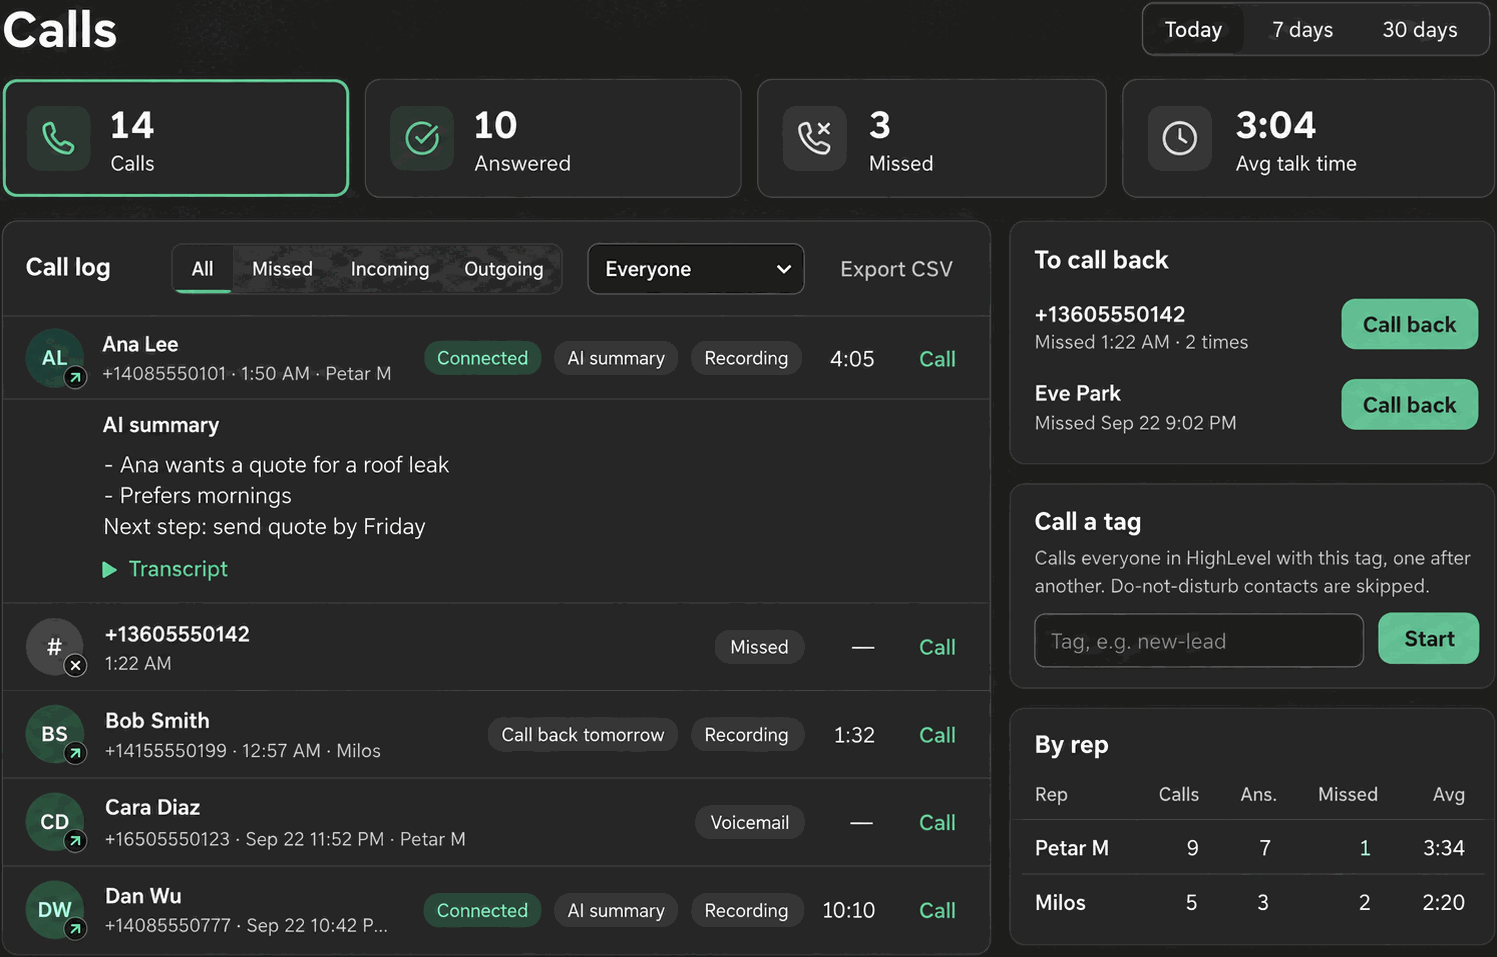
If you manage a team taking calls inside HighLevel, “how many calls did we make today, and who answered them” should not require pulling a spreadsheet together by hand. HighLevel call reporting in Phone Clover lives on the dashboard, next to the phone itself, with the metrics a manager actually checks day to day: call counts, answer rates, per-rep performance, and a CSV export when you need the raw rows. This guide walks through what is there, and what is not built yet.
Metrics managers need
The dashboard opens with four stat tiles for the selected period: Calls, Answered, Missed, and Avg talk time. Clicking the Calls or Missed tile filters the call log below it to match, so a manager scanning for a spike in missed calls can go from the headline number to the actual list of calls in one click.
This view is scoped by role. A rep sees their own calls only. An admin sees the whole sub-account’s activity, including rings nobody on the team caught, which is the number a rep-only view would never surface on its own.
Today / 7 / 30 day views
Three period buttons control the window: Today, 7 days, and 30 days. The server caps lookback at 90 days even if you try to query further back through the API directly, so treat 30 days as the practical working window for regular reporting, and plan to export anything older before it ages past that range.
The dashboard refreshes automatically every 60 seconds, and again immediately after any call gets logged, so the numbers on screen stay current without a manual reload. A background refresh is careful not to rebuild a row you already have expanded, so it will not interrupt a recording you are listening to.
Call log filtering
Below the stat tiles, the call log itself can be filtered to All, Missed, Incoming, or Outgoing. For sub-accounts with two or more reps, an admin-only rep filter appears too, defaulting to “Everyone” until you narrow it to a specific person. Expanding a row shows a recording player if one exists, plus an AI summary and a collapsible transcript if the paid transcription add-on has run on that call.
Note: Charts over time are not built yet. What you get today is stat tiles and tables for whichever period you have selected, not a trend line across days or weeks. If your reporting process depends on a visual trend, you will need to export to CSV and chart it elsewhere for now.
By-rep stats
The “By rep” table, visible to admins only, breaks the same Calls / Answered / Missed / Avg metrics down per person. This is where the real coaching value sits: a rep with a high missed count relative to their peers, or a much shorter average talk time, is worth a conversation, and this table is what surfaces it without manually cross-referencing the call log.
One detail worth knowing before you read too much into a number: the by-rep table counts each rep’s leg of a call before ring-all collapses everyone’s simultaneous ring into a single logged call. That means on a ring-all call three reps let go before a fourth answered, all three show a miss on their individual row, even though the call itself ultimately connected. That is intentional, since the point of the table is to see who did and did not respond, not just whether the call was eventually answered by someone.
The dashboard also includes a “Team” card (admin only) showing available, away, or offline status per rep, and a “To call back” card listing missed calls from the last 7 days nobody has since followed up on, capped at 20 rows.
Reading the dashboard day to day
A practical routine for a manager checking in on team call activity might look like this:
- Start on Today. Glance at Calls, Answered, and Missed for the sub-account as a whole. A missed count that looks high relative to total calls is worth a closer look before the day ends, especially if there is still time to work the to-call-back list.
- Switch to the rep filter if something looks off, to see whether the miss rate is spread evenly or concentrated on one person.
- Check the by-rep table at the end of the day or week, comparing Calls, Answered, Missed, and Avg talk time across the team. Remember that ring-all calls count per rep before they collapse, so a rep who let several ring-all calls go will show more misses than the sub-account total might suggest at first glance.
- Clear the to-call-back list. This is the most actionable card on the dashboard: real customers who called, got nobody, and have not been called back yet.
- Export to CSV at the end of a week or month if you need to build a longer-term view, keep an archive, or hand a report to someone outside of Phone Clover.
What the numbers do and do not tell you
A few honest caveats worth keeping in mind when you read this data:
- Avg talk time is an average, not a distribution. A rep with a high average might be having genuinely productive conversations, or might be stuck on a few unusually long calls. The number alone will not tell you which.
- Missed counts include calls nobody was available for, not just calls a specific rep let ring. On a ring-all setup, a sub-account fully staffed but simply busy on other calls will still show misses.
- The 30-day view is a working window, not a full history. For anything you want to keep long term, export it, since the server itself will not return data past 90 days even through a direct query.
None of this replaces judgment. The dashboard tells you where to look. What is actually happening on a specific call, tone, objection handling, whether a rep needs coaching, still requires listening to the recording or reading the transcript, both available from the expanded call log row.
CSV exports
The Export CSV button builds a file client-side, with a UTF-8 byte-order mark for clean Excel
compatibility, and it is disabled when there is nothing to export for the current filter. Every
field that starts with a character like =, +, -, or @ gets a leading apostrophe added
automatically, to prevent a spreadsheet formula-injection issue. Exports are capped at 1000
rows, and the columns are Date, Time, Direction, Number, Contact, Rep, Outcome, Talk seconds,
Recording, and AI summary.
For a sub-account with heavy call volume over a full month, 1000 rows may not cover everything in the window; export more frequently, or narrow your filter first, if you need a complete record.
Setting up the rep filter and reading it correctly
For sub-accounts with two or more reps, the rep filter appears on the call log, defaulting to “Everyone.” A few tips for using it well:
- Filter to one rep at a time when reviewing performance, rather than trying to eyeball a mixed log. Combined with the Missed filter, this quickly shows exactly which calls a specific rep did not answer.
- Cross-reference with the Team card. A rep showing up as “Away” or “Offline” during a stretch of missed calls is a different story than a rep who was “Available” and still missed calls, and the Team card is what tells you which one happened.
- Remember admin-only visibility. Reps cannot see this filter or the by-rep table themselves; if you want a rep to see their own historical performance, that conversation has to happen outside of what the dashboard currently exposes to a non-admin.
Exporting for a longer-term view
Since trend charts are not built into the dashboard yet, any manager who wants to track call volume or answer rate over months, not just the current 30-day window, needs to export regularly and keep their own record:
- Set the period and filter to whatever slice of data you want.
- Click Export CSV. The button is disabled automatically if there are no rows to export.
- Open the file in a spreadsheet tool. The UTF-8 byte-order mark keeps special characters intact
in Excel, and any field starting with
=,+,-, or@will have a leading apostrophe added to prevent it from being misread as a formula. - Build your own week-over-week or month-over-month comparison from the exported columns: Date, Time, Direction, Number, Contact, Rep, Outcome, Talk seconds, Recording, and AI summary.
A simple habit, exporting weekly and keeping the files in one folder, gets you most of the way to a trend view without waiting for that feature to ship natively.
When Phone Clover fits, and when it does not
Phone Clover’s call reporting fits a manager who wants a live view of team call activity, who to coach, and which calls still need a callback, without exporting spreadsheets from three different places. The by-rep table and to-call-back list in particular cover the two questions managers ask most: who is underperforming, and what is about to fall through the cracks.
It does not fit a team that needs trend charts, a multi-sub-account agency rollup, or exports larger than 1000 rows in one pull, since none of that exists today. If your reporting process depends on visualizing call volume over months or comparing multiple sub-accounts side by side, plan to pull data out via CSV and build that view in a separate tool.
Related reading: Dashboard metrics overview, Call log filters, By-rep stats, Export the call log to CSV, and the dashboard and reporting product page.